Research into Mobility in the Netherlands
Q-Park is probably the biggest owner of parking garages in the Netherlands. Based in Maastricht, they own dozens of parking garages throughout the Netherlands. They asked the BISS Research Insitute to show how Data Science can be used to gain understanding in their customer base and potentially identify new customer segments.
We got access to and used the data collected by CBS in their OViN research. OViN (Onderzoek Vervoer in Nederland) is a study of multiple years to the ways in which people move in the Netherlands. We used this data to answer the research questions posed by Q-Park.
We started with extensive descriptive analytics in order to get an idea how choices for modes of transportation differed from person to person. We had several findings, such as non-linear relationships indicating that people prefer the car for trips between 30-90 minutes, but longer or shorter they are more likely to take alternative modes of transportation.
To really get an idea of what factors go in-depth and get an idea of what factors play a role in this choice, we relied on Bayesian Networks. The influence of numerous factors was investigated, ranging from demographic, to geographic to trip-specific factors. In a possible next stage we will look into multi-level modeling, as the dataset has a very interesting hierarchy to it. On the highest level the data consists of people moving (Onderzoekpersoon, or OP). Each OP has multiple movements (Verplaatsing), where each movement consists of multiple rides (Rit). It would thus be interesting to see how factors on different levels affect choices on the different levels. Does a person’s income influence the relationship between taking the car versus public transportation?
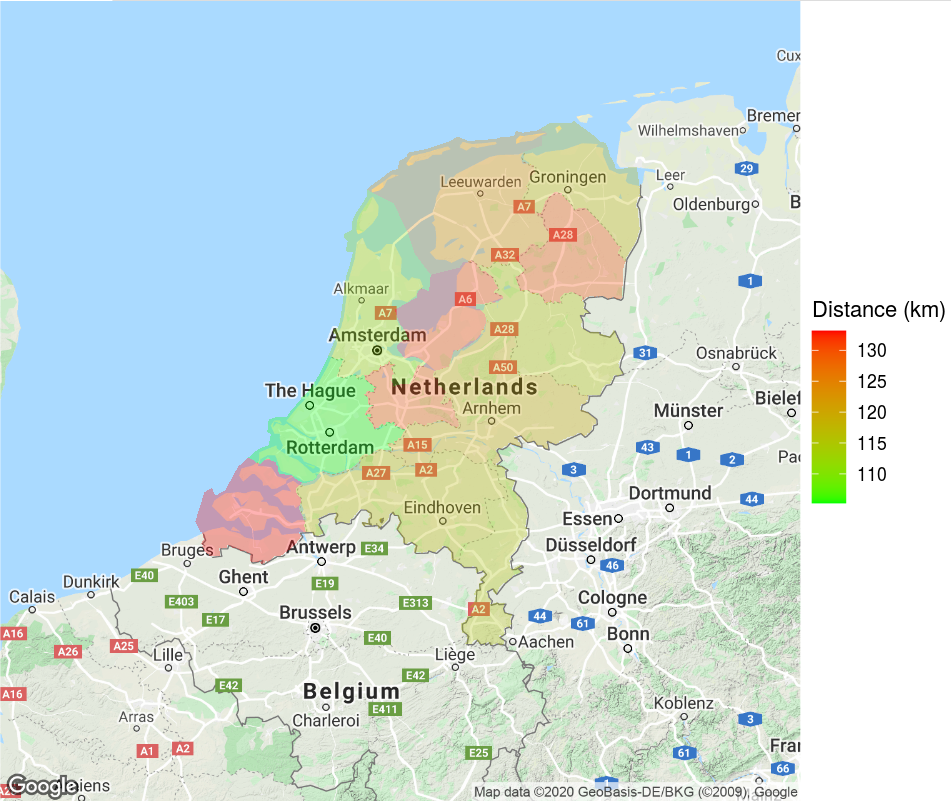
But apart from the specific questions from Q-Park, the same dataset can be to answer different questions as well. We did a small investigation towards differences between provinces. How long and far do people travel with a certain provice as destination or as starting point? What proportion of people takes the car? We used the dataset to create a small, initial dashboard as an RShiny App to play around with. The picture below is a screenshot of the map of the Netherlands showing how far people on average travel to arrive at a destinaion in the given province. People traveling to Zeeland, Flevoland, Utrecht and Drenthe come from a lot futher than people traveling to Zuid-Holland. If you want to play around: https://markgraus.shinyapps.io/OViNDashboard/
All in all, since we relied on panel data, this research was a bit different from what I normally do, even though choices for mode of transportation are in a way consumer decisions as well.
Leave a Reply