A Data Science Approach to Monitoring Fitness in Preparation of My First Race
A Data Science Approach to Monitoring Fitness in Preparation of My First Race
In preparation for my first ever race, I’ll be mining the data from my cycling computer. I’m trying to see if and how I can draw conclusions about my fitness from these data, mainly by investigating the relationship between heart rate and velocity.
When 2018 came around I decided on a bit of an out-of-character new year’s resolution. I’ve registered for the Giro delle Dolomiti, a cycling race over 6 days, totaling 580 km and 11000m elevation. Now I’ve been cycling for something like 5 years and over time I have become more and more data-driven in my cycling. In preparation for the Giro I will be following quite a tight training schedule and I decided to see if I can use data to get an idea of how my fitness progresses.
Cycling is a sport that lends itself for a data-driven approach, as illustrated by the success of by for example Strava, Training Peaks, and Zwift, etc… About three years ago I joined the data-driven movement and bought myself a Garmin Edge 500 cycling computer that stores all kinds of information. Most basically it stores my location, speed, cadence, heart-rate, elevation, temperature, and a whole lot more.
Apart from all these numbers, a lot of people use power meters. Power meters measure the amount of power cyclists transfer onto the pedals, into the crank, onto the wheel and finally on the road. The reason people use power is that it is a very direct measure, and a very good measure of fitness.
Now as a PhD student, I cannot (or choose not to) afford a power meter. On the other hand I am a data scientist and I have data… so I am trying a somewhat different approach.
When training more structured than just cycling whenever you can, at the least you will need to measure heart rate. Heart rate is a nice indicator of how much work you do. There are a number of interesting metrics with regards to heart rate in relationship to fitness. Strong indicators of fitness are your resting heart rate, maximum heart rate, and the maximum heartrate you can hold for a set amount of time (FTHR or Functional Treshold Heart Rate).
While heart rate can be used to assess your fitness, I think it is hard to see it in isolation. Someone who cycles at 25km/h at 90% of his max heart rate is less fit than someone who cycles 25km/h at 80% or 30km/h at 90%. Thus I want to focus specifically on the relationship between heart rate and speed. The faster I go, the more work I am doing and the higher my heart rate will be. So that is exactly where I began my analysis.
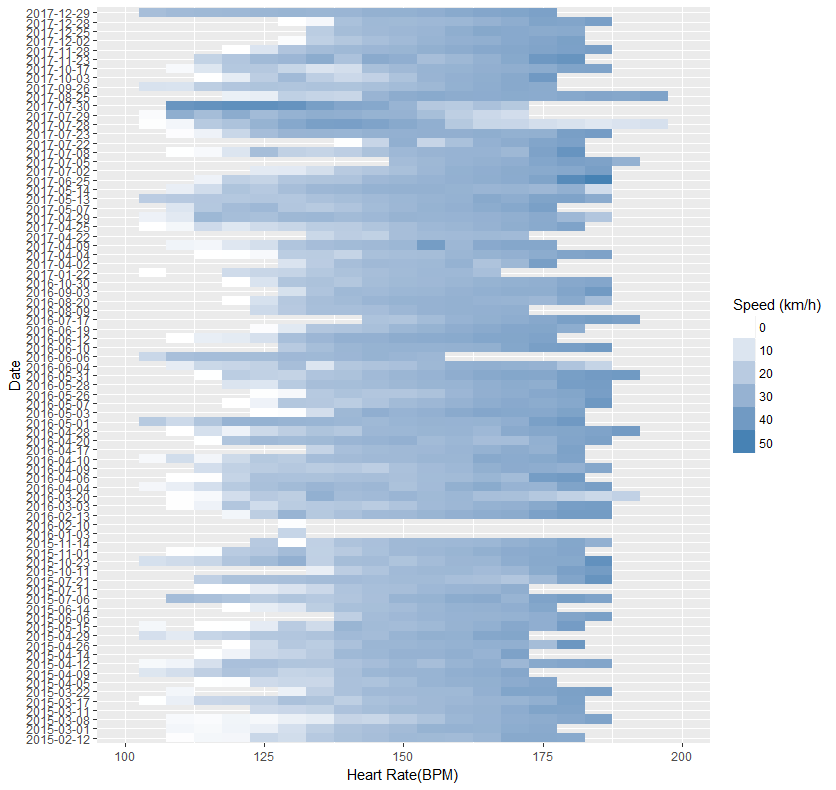
To the left you can find a first very basic analysis. I collected all my ride data through Strava’s API. Each ride is visualized as a blue horizontal line. For every ride the average speed (the darker the shade, the faster) is plotted against the heart rate (increasing from left to right in intervals of 5 BPM). My max heart rate is 195, which you see I reached only a couple of times. You can see that at higher heartrates I cycle faster, as there are darker shades of blue to the right. A bit difficult to see is that I also became faster, as the top rows are also (ever so slightly) more blue than the bottom rows.
But there are some unexpected things. Zooming into the end of July, there are three dates where the relationship between heart rate and speed goes a bit wonky. I reach the highest speeds at lower heartrates.
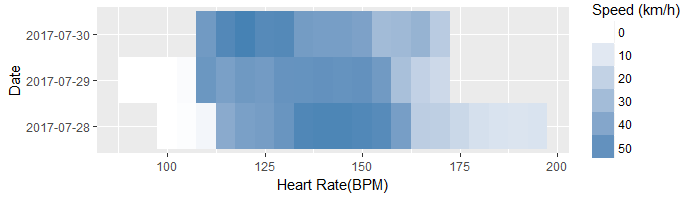
During these I was cycling in the Vosges on France. And the thing with the Vosges is is that they are mountains and in mountains there typically is climbing and descents. Climbing takes place at lower speeds and higher heartrates and descents go in the opposite way. Thus we can expect that the relationship between heart rate and velocity is not as clearly defined.
This is just one example of how the relationship between heart rate and velocity is influenced, but there are many such examples. They range from the obvious things like whether your cycling uphill or downhill, or whether you have a head or tail wind, to the maybe less obvious things like whether you are riding in a group or what the compound of your tires is.
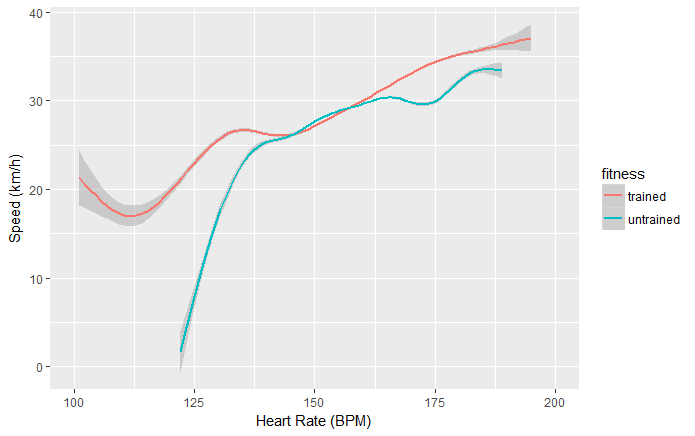
In order to compensate for the different slopes, I decided to right now opt for the easiest approach and filter the data. If I look at only the data points where I am cycling outside and on flat ground, the graph looks as below. This is a lot less noisy, but there is still plenty of room for improvement.
This analysis is admittedly very basic and there are many ways to improve and extend it, which I will do during the coming months as I work through my training schedule.
Firstly I will be looking at incorporating the data into the model. For this analysis I discarded data from during climbing or descending, but this is also something that can be incorporated. Similarly, I can look at information regarding temperature, whether or not I ride in a group, whether I ride a long or short distance.
In addition I plan on looking at different indicators of fitness. One that comes to mind is the time it takes for my heart rate to return back to normal after an effort, as fitter people tend to return to a lower heart rate faster. Similarly I will be looking at the duration in which I can sustain a certain velocity or heart rate, as I think these will go up when my fitness increases.
Finally, I will be looking at the longitudinal patterns, or how my fitness changes over time. Logically I will be fitter in periods in which I train several times a week than right after a (dad-becoming) break. One way to look at this is defined in the training impulse (or TRIMP) model. This is also my main focus of interest in preparation for the Giro delle Dolomiti, as I hope to be my fittest ever before the start.
In the end, I think this is approach is quite likely to work out. When it comes to cycling, the models are pretty straightforward, whether you’re looking at the physical model of how heart rate relates to effort and how effort relates to speed, or at models that describe how fitness is influenced by training volume. To complement the clear models, there are lots of data. The combination of these two properties makes it in my opinion a great use case for data science.
Leave a Reply